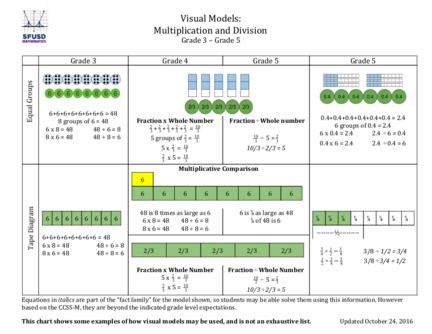
This pdf shows some examples of how visual models may be used to multiply and divide two numbers. It explains the multiplication and division of a fraction with a whole number and the multiplication of 2-digit numbers.
1. Visual Models: Multiplication and Division Grade 3 – Grade 5 Grade 3 Grade 4 Grade 5 Grade 5 6+6+6+6+6+6+6+6 = 48 Fraction x Whole Number Fraction ÷ Whole number 0.4+0.4+0.4+0.4+0.4+0.4 = 2.4 8 groups of 6 = 48 2 2 2 2 2 10 6 groups of 0.4 = 2.4 6 x 8 = 48 48 ÷ 6 = 8 3 +3+3+ 3+3 = 3 6 x 0.4 = 2.4 2.4 ÷ 6 = 0.4 8 x 6 = 48 48 ÷ 8 = 6 5 groups of 23 = 103 10 ÷ 5 = 23 3 0.4 x 6 = 2.4 2.4 ÷ 0.4 = 6 5 x 23 = 103 10/3 ÷ 2/3 = 5 2 10 3 x5= 3 Multiplicative Comparison 6 6 6 6 6 6 6 6 6 48 is 8 times as large as 6 6 is ⅛ as large as 48 6 6 6 6 6 6 6 6 6 x 8 = 48 48 ÷ 6 = 8 ⅛ of 48 is 6 ⅛ ⅛ ⅛ ⅛ ⅛ ⅛ ⅛ ⅛ 8 x 6 = 48 48 ÷ 8 = 6 --------½--------- 6+6+6+6+6+6+6+6 = 48 6 x 8 = 48 48 ÷ 6 = 8 3 1 8 x 6 = 48 48 ÷ 8 = 6 2/3 2/3 2/3 2/3 2/3 4×2 = 38 3/8 ÷ 1/2 = 3/4 1 3 2×4 = 38 3/8 ÷ 3/4 = 1/2 Fraction x Whole Number Fraction ÷ Whole Number 2 10 5x 3 = 3 10 2 3 ÷ 5=3 2 10 3 x5= 3 10/3 ÷ 2/3 = 5 Equations in italics are part of the “fact family” for the model shown, so students may be able solve them using this information. However based on the CCSS-M, they are beyond the indicated grade level expectations. This chart shows some examples of how visual models may be used, and is not an exhaustive list. Updated October 24, 2016
2. Visual Models: Multiplication and Division Grade 3 – Grade 5 Grade 3 Grade 4 Grade 5 Grade 5 0.4+0.4+0.4+0.4+0.4+0.4 = 2.4 6 groups of 0.4 = 2.4 6 x 0.4 = 2.4 2.4 ÷ 6 = 0.4 6+6+6+6+6+6+6+6 = 48 48-6-6-6-6-6-6-6-6 = 0 0.4 x 6 = 2.4 2.4 ÷ 0.4 = 6 8 groups of 6 = 48 6 x 8 = 48 48 ÷ 6 = 8 Fraction x Whole Number 2 2 2 2 2 10 Fraction ÷ Whole Number 8 x 6 = 48 48 ÷ 8 = 6 3 +3+3+ 3+3 = 3 5 groups of 23 = 103 10 ÷ 5 = 23 3 5 x 23 = 103 10/3 ÷ 2/3 = 5 3 2 3 x5= 3 10 4 × 12 = 38 3/8 ÷ 1/2 = 3/4 1 2 × 34 = 38 3/8 ÷ 3/4 = 1/2 Equations in italics are part of the “fact family” for the model shown, so students may be able solve them using this information. However based on the CCSS-M, they are beyond the indicated grade level expectations. This chart shows some examples of how visual models may be used, and is not an exhaustive list. Updated October 24, 2016
3. Visual Models: Multiplication and Division Grade 3 – Grade 5 Grade 3 Grade 4 Grade 5 Grade 5 0.3 x 0.4 = 0.12 0.12 ÷ 0.3 = 0.4 6 x 8 = 48 48 ÷ 6 = 8 8 x 6 = 48 48 ÷ 8 = 6 0.4 x 0.3 = 0.12 0.12 ÷ 0.4 = 0.3 2-digit x 2-digit ÷ 2-digit Divisor Whole Numbers Whole Numbers 11 x 13 = 143 143 ÷ 13 = 11 13 x 11 = 143 143 ÷ 11 = 13 2 4 x 13 = 52 52 ÷ 4 = 13 3 x 12 = 2 6 2/6 ÷ 1/2 = 2/3 13 x 4 = 52 52 ÷ 13 = 4 1 2 x 23 = 2 6 2/6 ÷ 2/3 = 1/2 0.7 x 1.3 = 0.91 0.91 ÷ 0.7 = 1.3 7 x 138 = 966 966 ÷ 7 = 138 1.3 x 0.7 = 0.91 0.91 ÷ 1.3 = 0.7 138 x 7 = 966 966 ÷ 138 = 7 4 x 13 = 52 52 ÷ 4 = 13 13 x 4 = 52 52 ÷ 13 = 4 14 x 36 = 504 504 ÷ 14 = 36 2 12 x 1 13 = 2 86 = 3 26 36 x 14 = 504 504 ÷ 36 = 14 1 13 x 2 12 = 2 86 = 3 26 Equations in italics are part of the “fact family” for the model shown, so students may be able solve them using this information. However based on the CCSS-M, they are beyond the indicated grade level expectations. This chart shows some examples of how visual models may be used, and is not an exhaustive list. Updated October 24, 2016
4. Visual Models: Multiplication and Division Grade 3 – Grade 5 Connection to Algorithms: Multiplication (3 x 1 digit) Fuson, Karen C. and Beckmann, Sybilla. Standard Algorithms in the Common Core State Standards. NCSM Journal. Fall/Winter 2012-2013. https://www.mathedleadership.org/docs/resources/journals/NCSMJournal_ST_Algorithms_Fuson_Beckmann.pdf This chart shows some examples of how visual models may be used, and is not an exhaustive list. Updated October 24, 2016
5. Visual Models: Multiplication and Division Grade 3 – Grade 5 Connection to Algorithms: Multiplication (2 x 2 digit) Fuson, Karen C. and Beckmann, Sybilla. Standard Algorithms in the Common Core State Standards. NCSM Journal. Fall/Winter 2012-2013. https://www.mathedleadership.org/docs/resources/journals/NCSMJournal_ST_Algorithms_Fuson_Beckmann.pdf This chart shows some examples of how visual models may be used, and is not an exhaustive list. Updated October 24, 2016
6. Visual Models: Multiplication and Division Grade 3 – Grade 5 Connection to Algorithms: Division Fuson, Karen C. and Beckmann, Sybilla. Standard Algorithms in the Common Core State Standards. NCSM Journal. Fall/Winter 2012-2013. https://www.mathedleadership.org/docs/resources/journals/NCSMJournal_ST_Algorithms_Fuson_Beckmann.pdf This chart shows some examples of how visual models may be used, and is not an exhaustive list. Updated October 24, 2016